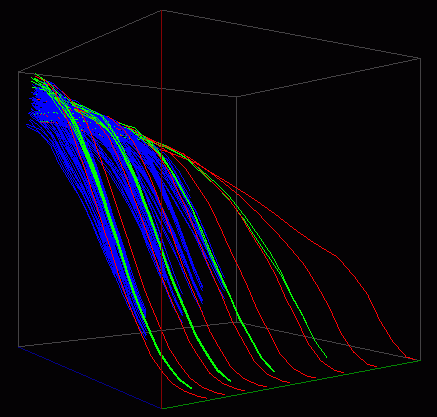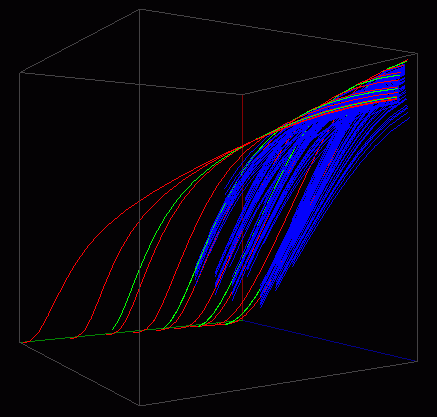

TADAM uses a 3-dimensional state space: Top height (H), Basal area (B), and trees per hectare (N). Here are two graphs showing (a) the TASS predicted trajectories in the TIPSY database, and (b) the trajectories predicted by TADAM starting from the same initial points.
The axes are H (blue), B (red), and log N (green). Logs were used for N to achieve a more even spread. The red trajectories are unthinned, the green had a pre-comercial thinning at height 6 m, and the blue are after commercial thinnings.
If you have a VRML plugin installed (e.g. Cortona), click on the graphs to move them around.