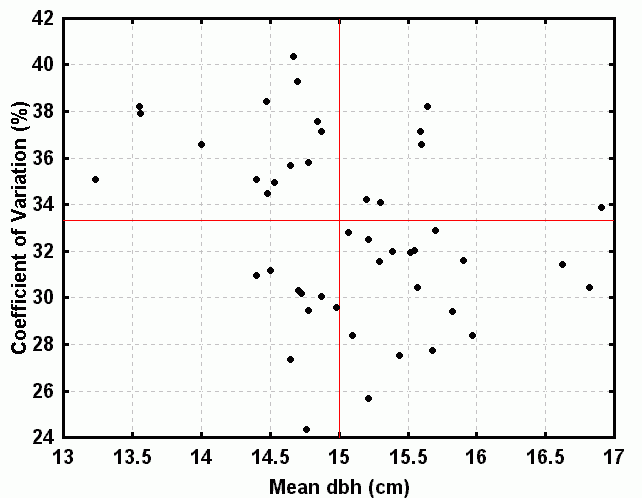
The graph shows the mean and CV of the initial random dbh tree list (40 trees) generated by each student. The "true" mean and CV were 15 cm and 33.3%, respectively.
Note that, in relative terms, the variability of the CV was about twice that of the mean. Shape indicators such as skewness and kurtosis would be even more variable.